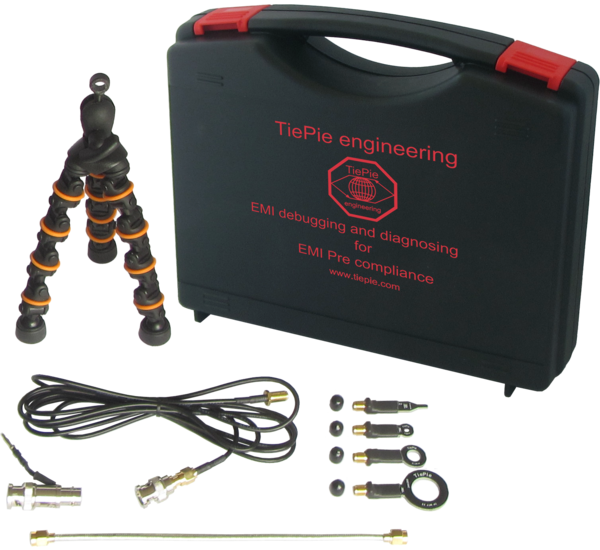
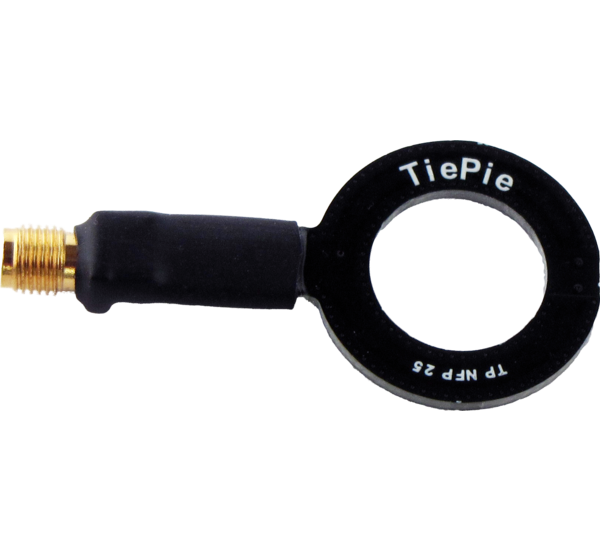


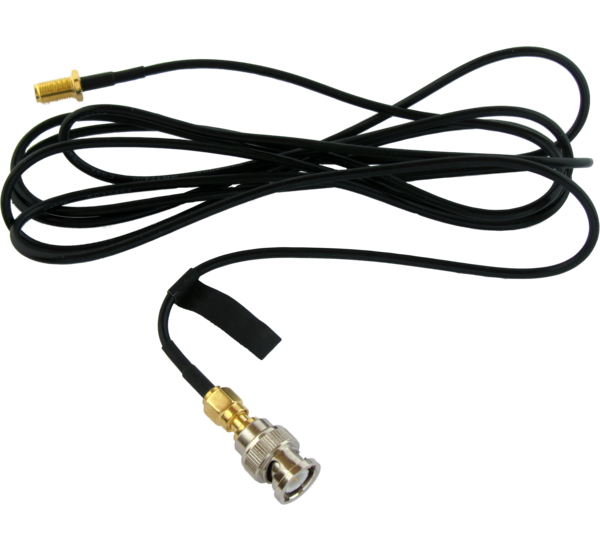
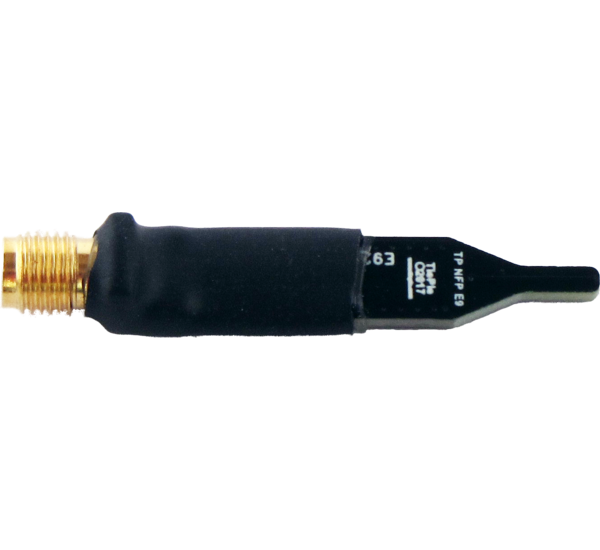
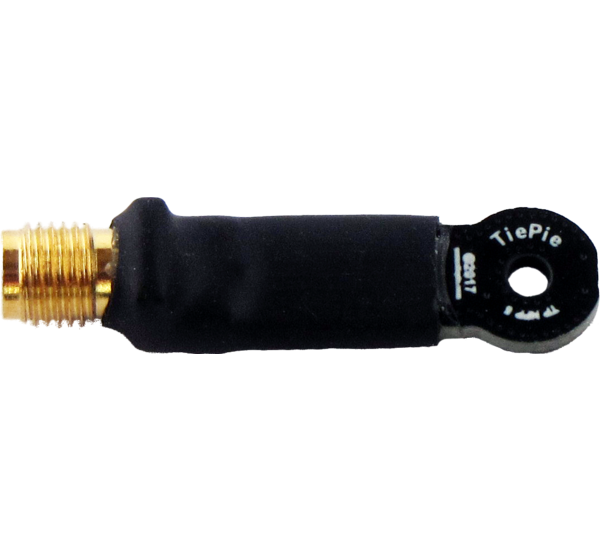
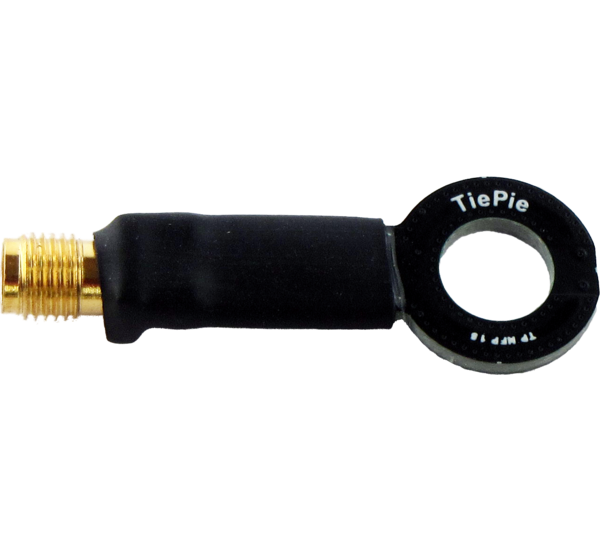
The powerful capabilities of the Handyscope HS6 DIFF – 1000XMESG EMI analyzer give the user the possibility to quickly perform a good EMI compliance test. With this cost effective test, time and money are saved by avoiding extra visits to expensive EMC testing facilities. The supplied EMI probe set TP-EMI-HS6 contains three magnetic field (H field) probes and one electric field (E field) probe. The tripod ensures that the probes can be positioned properly at the object under test.
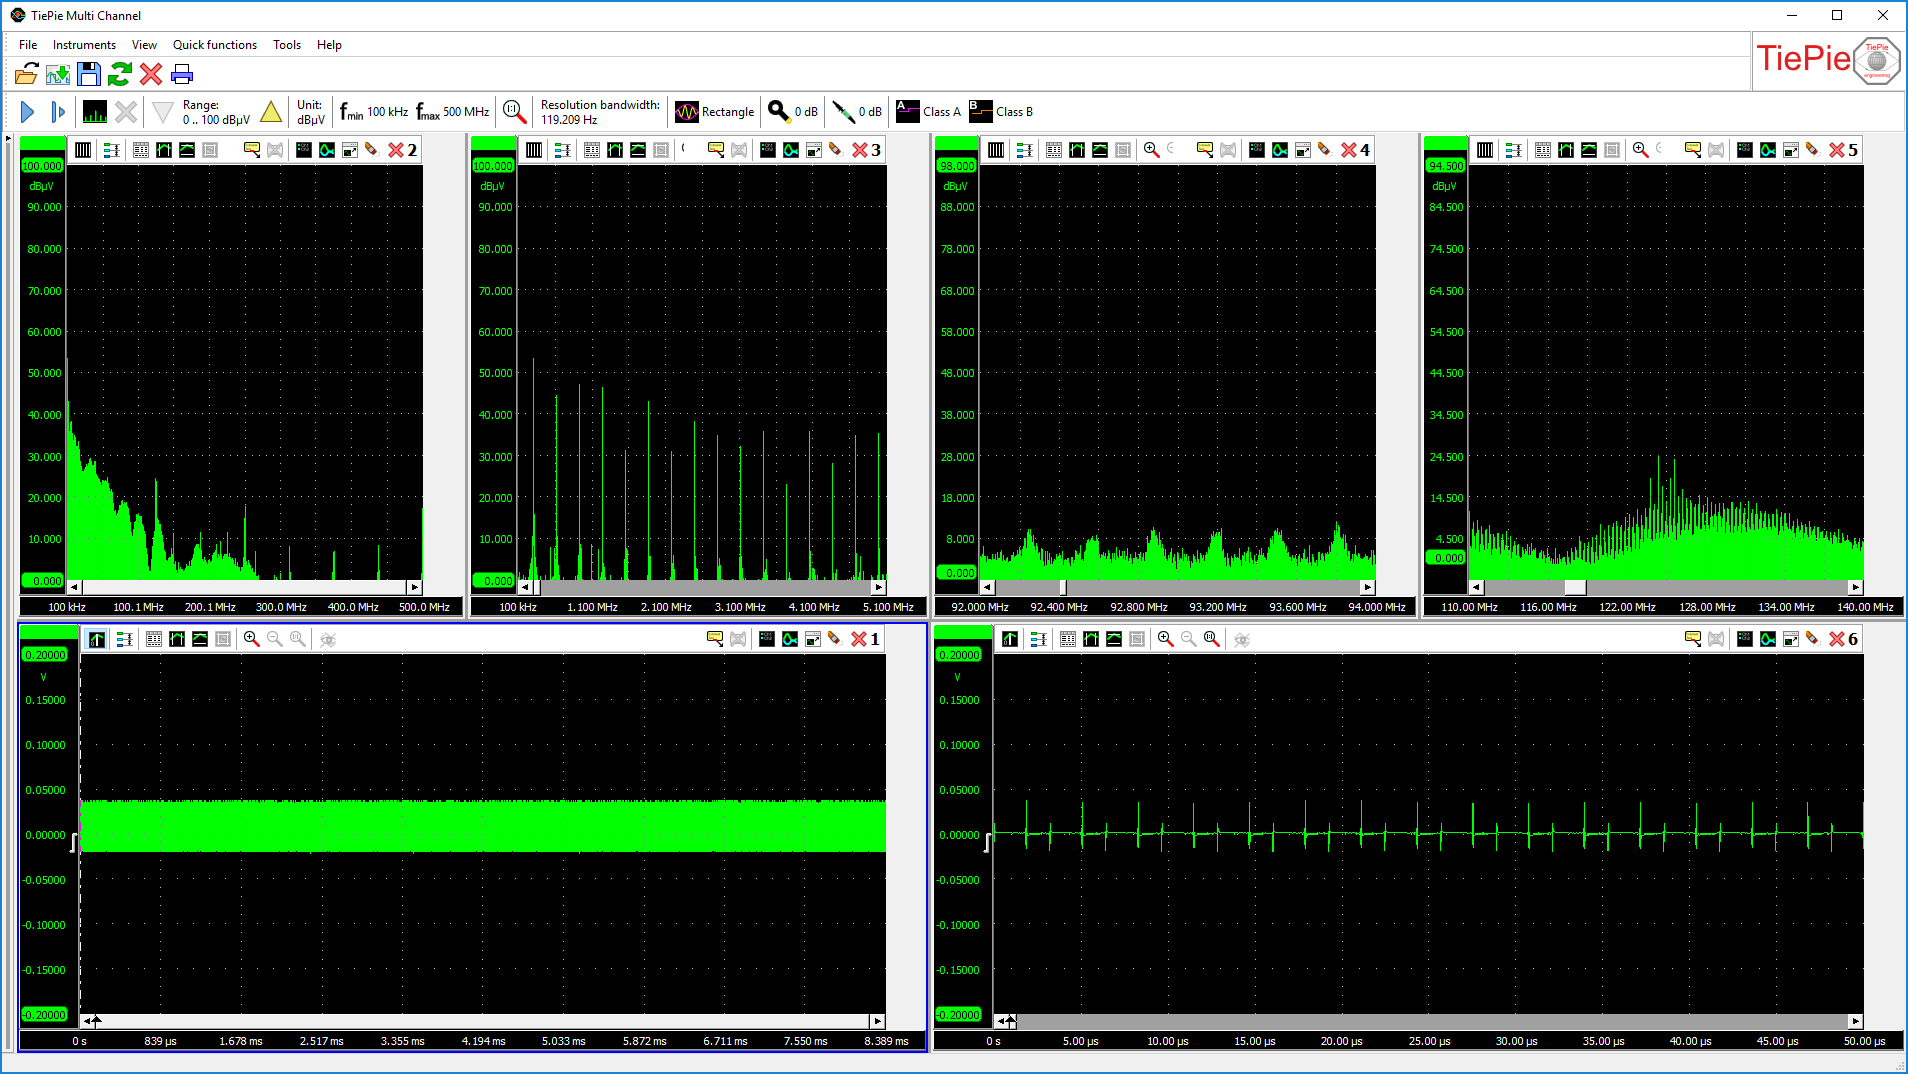
Figure 2: Above: a total spectrum from 0 Hz to 500 MHz and 3 displays with magnified parts of the live spectrum. Below: the total time domain signal and a magnified part of the time domain signal, live with the spectrum.
The Handyscope HS6 DIFF – 1000XMESG EMI analyzer has a very low resolution bandwidth of up to 7.45 Hz (at a span of 500 MHz), which is unique in its class. As a result, details in each part of the spectrum can be analyzed thoroughly.
The large dynamic range of 140 dB allows the measurement of a wide variety of interference frequencies. Standard limit lines according to EN61326-1:2006/EN55011:2007 can be switched on or off. The resolution bandwidth and frequency range can be selected individually.

There are three operating modes: Normal, Average and Max Hold. Normal mode displays the spectrum of the source trace. Averaging mode is effective in reducing the noise of the signal, to see more of the harmonic or carrier detail. You can select the number of spectra to be averaged. Max Hold displays the maximum level that the signal reaches and is useful for frequency measurements where it shows the history of peak values across the frequency axis. Averaging and Max Hold history can be cleared manually to start a new measurement.
With the extensive marker capabilities in the graph, various aspects of the spectrum can be measured.
The amplitude unit can be set to dB, dBv, dBmV, dBµV, dBµV (at 10m) and dBm. The amplitude range can be set to one of three ranges: 0 to 100 dBµV, 20 to 120 dBµV or 40 to 140 dBµV. For accurate amplitude measurement, a flat top window is used by default. Besides the flat top window, eight other windows can be selected from.
The EMI analyzer can also be used as normal spectrum analyzer. With a biconical antenna or Combilog Antenna a spectrum of 10 MHz to 500 MHz can be measured.
Figure 4 shows a spectrum measured with a Combilog antenna which was placed outside. Next to the full spectrum from 0 Hz to 500 MHz, there is also a view with the FM band of 87.5 MHz to 108 MHz, an FM radio station at 92.2 MHz and even an AM radio station at 1600 kHz. The time domain signal is also shown, as well as a zoomed in part of the time domain signal. All windows are real time and correlations between different frequencies and the time domain signal can be conveniently viewed. The multi window feature of the EMI analyzer offers the user unlimited analysis and display capabilities.
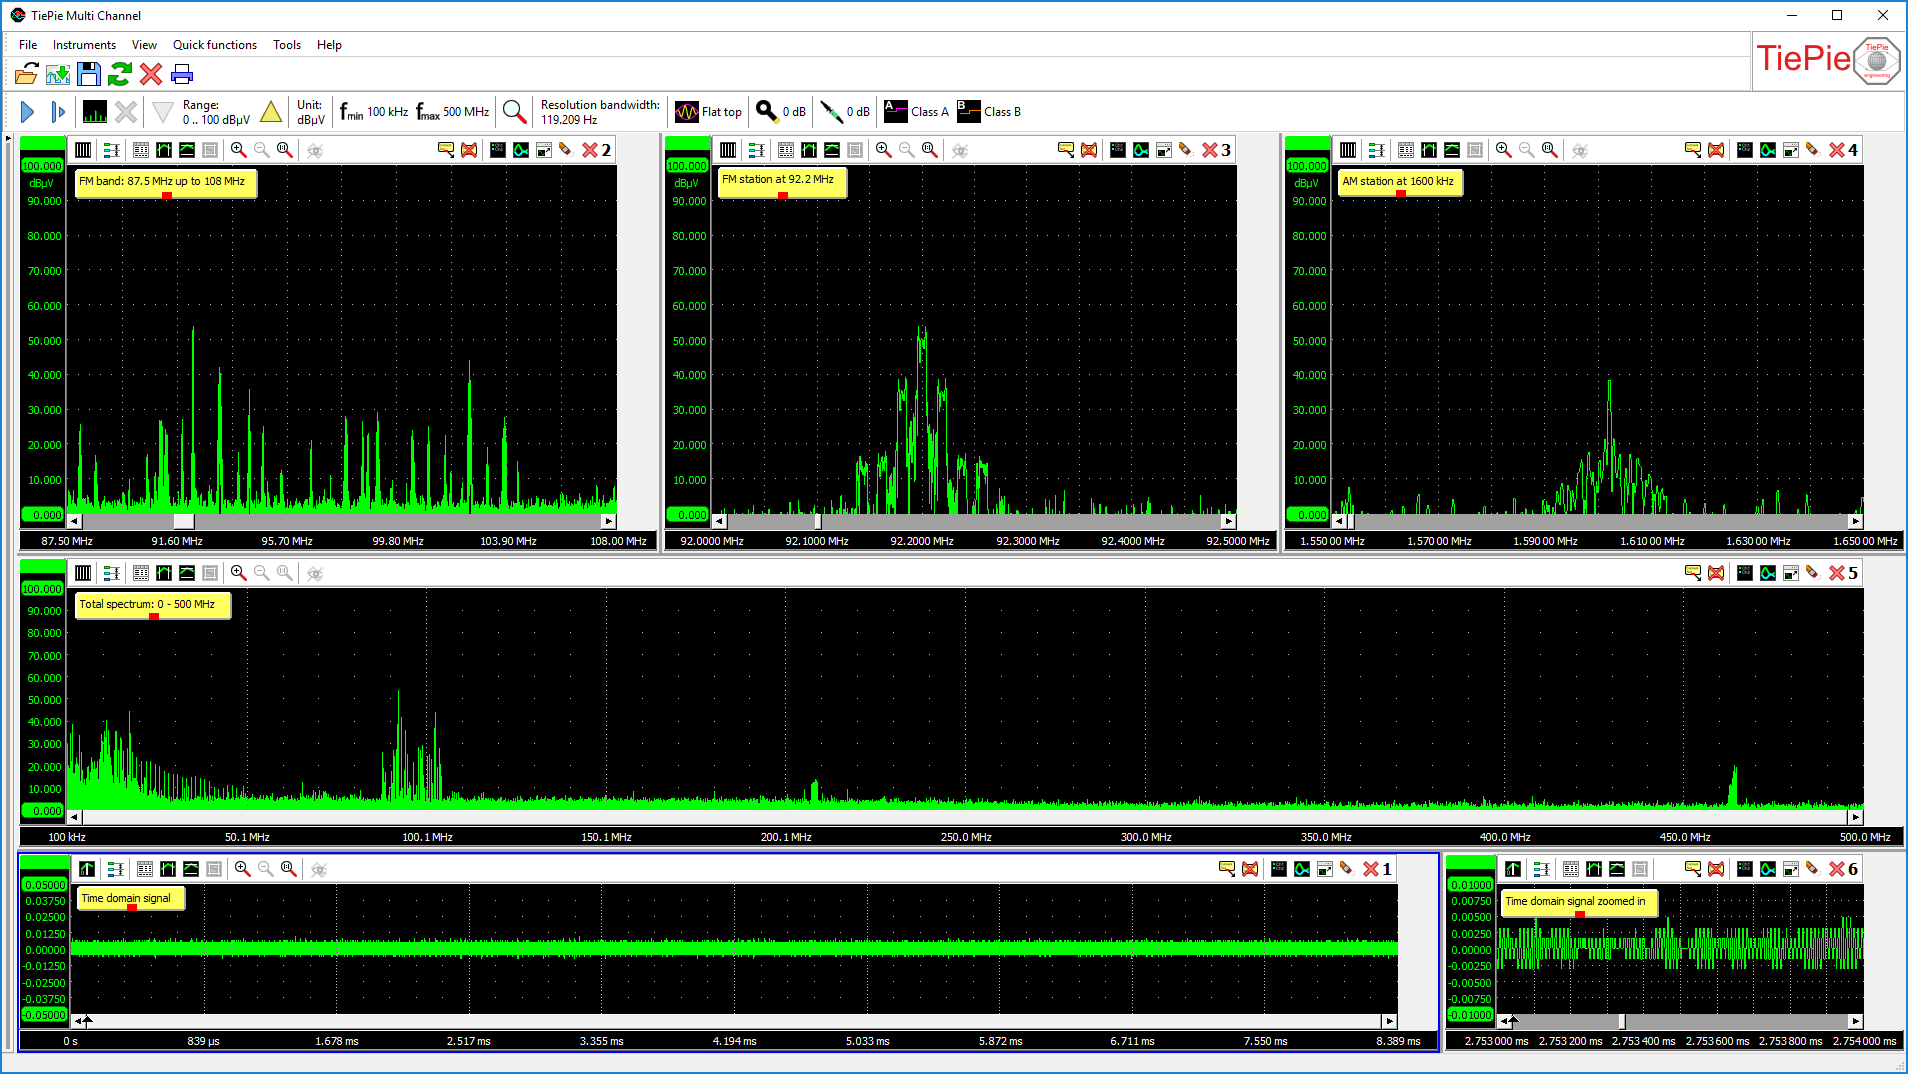
Figure 4: Using the Quick Setup button, the EMI analyzer can be controlled fast and easy.


